 Login AI
High-Load Backend Systems Design
We design and build server systems that keep their load without degrading: we profile, then remove bottlenecks in databases, network I/O, and serialization. We also price your current architecture in servers, so you can see what changes after the workload moves to an async runtime.
Engineering for distributed systems that move millions of events and hold a hard response-time budget.
Pricing
from ₽2,500,000
per project
This is the lower bound of a project. We scope the exact quote after a brief: it depends on volume and the number of integrations.
Capabilities
Throughput
We hold hundreds of thousands of concurrent connections on one server: work runs concurrently, so cores don't sit waiting on the network.
Lower infrastructure bill
We move workloads to native code and put your CPUs to work instead of adding machines. The same traffic runs on fewer servers, and we show the difference in the quote before the work starts.
Memory safety
The compiler rejects use-after-free and data races at build time. The service doesn't crash on a bug that no test managed to catch.
Predictable response time
We measure the tail, not the average: the 99th percentile stays inside the agreed range even during a traffic spike.
From request to result
1
Profiling audit
We profile the running system: memory distribution, network waits, slowest queries. Measurements come from real load, not from a synthetic staging setup.
2
Core design
We build async, non-blocking flows, split reads from writes, and set failure boundaries: what the system returns to a client while a dependency is down.
3
Storage optimization
We set up replication and sharding and move reporting to an analytical database, so heavy queries stop blocking transactions.
4
Stress testing
We push traffic above your working peak and record tail latency. You get numbers to compare our build against yours, not a promise that it will hold.
Check if it fits you
Good fit
Fintech services
Thousands of transactions a minute under a contractual response-time SLA you can't miss. We measure the tail, not the average, and bring it inside the agreed range.
IoT platforms
Sensor data arrives continuously, and a dropped packet is a lost event, not a lost log line. We keep the processing path non-blocking so latency doesn't pile up in a queue.
High-load SaaS
The interface slows under load while your hardware is still far from its limits. A database call per row of a list is usually the cause, and we find it with a profile instead of buying bigger machines.
Aggregation pipelines
You collect data from thousands of sources and aggregate it as a stream. We split collection, storage, and reporting so a heavy report never blocks new writes.
Not a fit
Early-stage MVPs
You're testing a hypothesis, not tuning a runtime. A native stack lengthens the path to the first feature, and if the hypothesis fails that time is gone.
Simple CRUD systems
An admin panel, a landing site, or a portal with no background computation. A managed runtime is enough there, and the switch to native code buys nothing you can measure.
Closed legacy estates
The system is built around frequent calls into closed C libraries with no stable interface. Wrapping those calls eats the benefit, and you'd have to negotiate with the vendor first.
Infrequent network calls
The service makes a few isolated requests a day. An async runtime is unnecessary there, and a standard solution has a much lower barrier to entry.
What you get
×4.5
stream data processing speed
We moved the streaming collection and processing of reviews off virtual machines onto an async runtime. The gain came from busy CPUs and the absence of garbage collection pauses, not from the language change by itself; the target response time held during traffic spikes.
100,000+ connections
Async runtime
The async runtime holds hundreds of thousands of concurrent connections on one server, so every core stays busy with work.
Fewer machines
Server savings
Server savings come from busy processors: the same traffic is served by fewer machines, and the difference is counted on your load profiles.
99th percentile
Tail latency
We measure latency tails, and the 99th percentile stays within the agreed corridor even during a peak spike.
Errors at build time
Memory safety
The compiler rejects access to freed memory and data races at build time, so some errors are caught before production.
Checks before kickoff
Memory profile by allocation
We take a memory profile by allocation rather than by resident size: you see which module holds memory between requests. That is how leaks in long-running processes surface, and they don't show up on a synthetic test because the workers there live for minutes.
Network waits separate from compute
We measure network waits separately from compute. When the CPU sits at 4% and response time still grows, the bottleneck is I/O or lock contention, and OS and connection-pool tuning buys more than moving to faster hardware.
Slow SQL from the plan
We find slow SQL in the query log and the execution plan, not in user complaints. A 400 ms table lock in a peak window becomes a queue of minutes once transactional traffic flows through it.
Degradation rules
We agree on degradation rules before writing code: which features to trim, which screens to serve from cache, and where an error is more honest than stale data. Behaviour under load should be your decision, not left to timeout defaults.
Distributed tracing
We add distributed tracing so you can see where the time actually goes: the network, a queue, the database, or serialization. Without it, a slow-response report starts with guesses.
Serialization as its own task
We treat serialization as its own task: under load, the size of the JSON payload noticeably changes what a request costs. A compact format and a copy-free parser free up CPU that would otherwise go into packing data.
How the system is built
Replication is set up for replica reads
Replication is set up so reads hit replicas while writes stay on the primary. Long selects then stop competing with transactions for the same locks.
Caching is layered
Caching is layered: frequent reads stay in process memory, and repeated calls to an expensive external service go to a shared Redis. We first look at which requests repeat and only then set expiry, otherwise the cache starts serving stale answers.
We plan sharding before the limits
We plan sharding before you hit the physical limits, and we pick a key that lands one customer's data on one shard. The wrong key turns a single lookup into a walk over the whole table.
Queues are built to survive failure
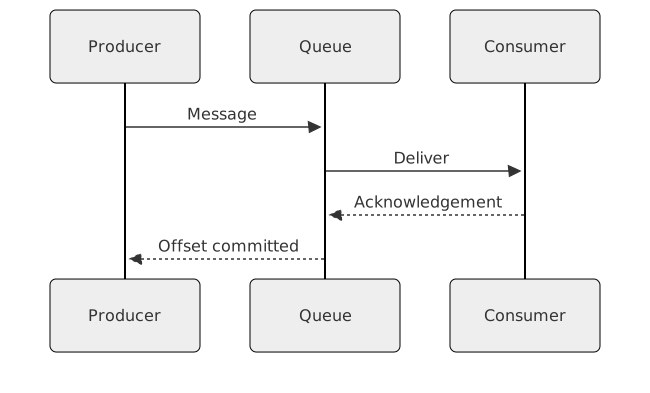
Queues are built to survive failure: acknowledgement after the result is written, and redelivery if the consumer dies. A heavy background job is then neither lost nor run twice, which synthetic demos rarely reveal.
Failover to a standby node is automated
Failover to a standby node is automated, with role checks and a delay measured in seconds. Planned database maintenance stops being a calendar event you announce a week ahead.
We build analytical indexes for the reports
We build analytical indexes for the specific reports you run, driven by measurements: every extra index slows writes and takes memory. We measure what heavy reporting costs before deciding whether to move it to its own tier.




Technologies
The technologies we use in our work and their role in a project.
Async runtime
We write services in Rust on a multi-threaded async runtime, Tokio. Strict ownership rules and the absence of garbage collection pauses remove unpredictable latency under load, and the Axum network layer holds thousands of concurrent connections per process.
Distributed storage
A PostgreSQL cluster with a bounded connection pool handles transactional work. Redis covers the cache and the queues, ClickHouse aggregates large volumes, and Elasticsearch runs full-text search.
Cost calculator
This is an indicative range, not a quote. We scope the exact estimate after a brief: it depends on volume and the number of integrations.
Duration, months
Complexity
Multi-region and HA
Add-ons
Support
Year one: updates and monitoring, a reply within 2 business days.
Service
High-Load Backend Systems Design
The estimate covers our team's work. Hardware, third-party service licences and travel are added on request.
Estimated cost
₽5.3M
Timeline
23 wk
Frequently asked questions
How does the design hold peak load without slowing down?
Requests are handled concurrently on a thread pool, and a network wait doesn't hold a thread: while the service waits for the database, it picks up the next request. Nothing pauses for garbage collection, so 99th-percentile latency stays inside its range even when users arrive in a burst.
How does moving to an async backend cut server costs?
The gain comes from putting your CPUs to work: instead of waiting on the network, a thread takes another task, and the same hardware carries more traffic. In practice that means fewer machines for the same SLA. We compute the exact number from your own load profiles, because without your data a claim like "ten times" is a guess.
What happens when the database slows down or goes down?
Backpressure goes into the network streams: when a dependency lags, requests are buffered in queues and then a circuit breaker opens. Some features switch to a degraded mode while the system stays up, and your client gets a clear answer instead of a timeout into the support line.
What do we need from your team?
Access to load profiles and metrics: request distribution, response-time tails, and storage configuration. We use them to find bottlenecks and run tests on staging before production.
What teams add to this service
Related Services
Part of Solutions
Implementation Examples
×4.5
Stream data processing speed
Ready to discuss your task?
Leave a request – we'll get back with a proposal and a preliminary estimate.
Contact us